Webinar recording
Dynamic Commentary in Power BI

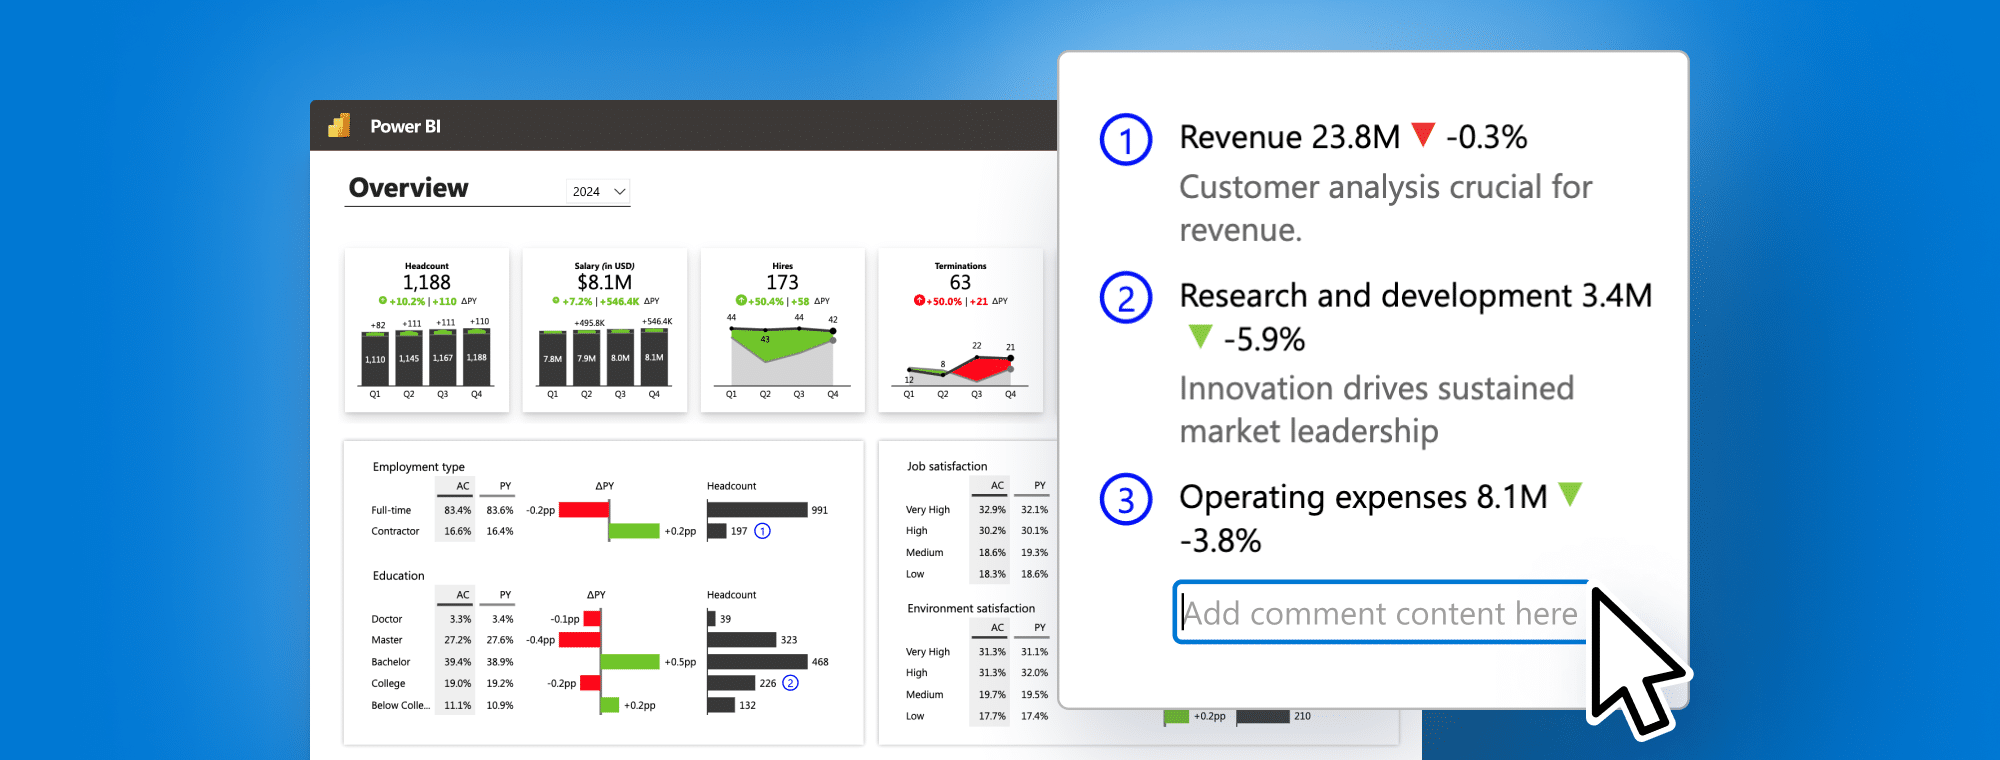
In this webinar, we’ll dive into both basic & advanced ways of commenting that is possible in Power BI.


What's included

Full video recording
PBIX example used in the webinar
Enjoy & thank you for watching! Don't hesitate to reach out if you have any questions — write to us at [email protected]!

Presenter

Andrej Lapajne

Founder & CEO at Zebra BI

Watch the Video

Get PBIX Example
Download the PBIX example that we used at the webinar to check how it's done, copy the DAX code, or steal any ideas you may find useful! 😘
Access the materials
(0:35) - Why is commenting in Power BI important?
(7:21) - Overview of 5 methods of commenting in Power BI
(11:19) - Comments table
(14:53) - Data model in Power BI
(16:49) - Importing your comments table
(19:19) - Loading your comments into your report
(21:06) - Design options for your comments
(27:52) - Comment number and Comment marker
(32:37) - Displaying value columns one below the other and other design options
(36:07) - Conditional formatting
(41:05) - Smart narrative
(53:47) - DAX used in this demo
(54:48) - Connecting comments to your visual
(58:47) - Q&A
Share this

Your Questions

Here are some of the questions that came up during our live session. Thank you for being such a proactive audience. Have more questions? Drop us a note at [email protected]!
Which commenting type do you prefer the most and do you think Smart narrative will become almost default commenting visual tool in PBI to use?

At the moment probably the option with dynamic Matrix is the safest and best working option since the matrix is one of the most used visuals in Power BI, hence bug-free.

In the Zebra BI Executive Summary dashboard, when you hovered over the Net earnings - 8.6M, it showed a small graph visual with a detail of the value. How did you do that?

By creating a report page tooltip. On a separate page, you create a visual that you want to display in a report page tooltip. Next, you connect this to the original visual (Matrix with a comment in our case). For a detailed explanation, you can read our step-by-step Report Page Tooltip article.

Next to a date ID, can there also be a company code ID / organisation ID, depending on the scope of your analysis or different department/business unit?

For sure. In our case data is connected to Date and KPI. Instead, you could have other dimensions Sales channels, Segments, Key Accounts, Company names, Countries, etc… No limitations! 🙂

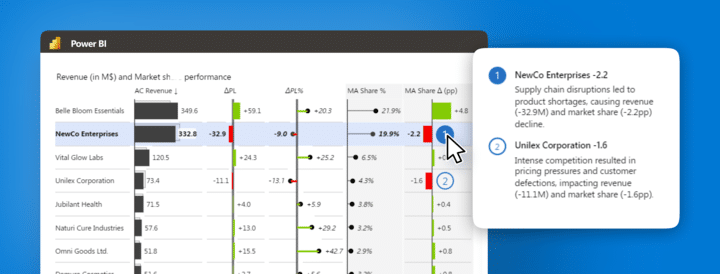
Prefer written step-by-step instructions?

Read the Article

Ready to start uncovering actionable insights from your data?

Explore Zebra BI for Office and Power BI, or start a trial instantly and test our tools on your data. You can also contact us to help you build your first test report and create a custom package for your business.

More Trending Webinars

New
September 12, 2024
Master Cost Management: Elevate Reporting, Tracking, and Efficiency
Master cost management with Zebra BI. Discover advanced techniques to optimize financial reporting, enhance budgeting accuracy, and make smarter, data-driven business decisions for long-term success.
Watch now
May 23, 2024
Mastering Brand and Product Portfolio Analysis in Power BI
Unlock the power of product portfolio analysis with Zebra BI in Power BI. Learn to visualize and analyze product performance, identify growth opportunities, and drive strategic business decisions with data-driven insights.
Watch now
April 18, 2024
Commentary Revolution: Transforming Power BI Dashboards with Dynamic Comments
Join our webinar to explore the easiest way so far to do dynamic commentary in Power BI for clearer insights, quicker decisions, and smoother meetings.
Watch now
New
PowerPoint
October 26, 2023
How to create board meeting PowerPoint slide decks like a consultant in 2023
After gathering all the data you need it's time to present it effectively to your managers. And this doesn't mean using many different shapes and colors that tell nothing. Learn practical tips for a professional-looking and actionable PowerPoint slide deck.
Watch now
September 14, 2023
From Data to Decisions: Real-Life Fortune 500 Financial Analysis with Power BI
This webinar is all about financial analysis in Power BI. Take a look at the performance of some of the biggest Fortune 500 companies and use these practical examples to apply them to your data. Don't just create reports, generate insights.
Watch now
Browse All Resources