Webinar recording
Mastering Brand and Product Portfolio Analysis in Power BI

Nielsen's market reports are recognized for their relevance across multiple sectors, including consumer goods, retail, media, pharmaceuticals, automotive, food and beverage, technology and finance. But mastering Nielsen data in Power BI for brand analysis and strategic decision-making can be complex. This webinar will introduce the strategic approach to using Nielsen data. You will gain actionable insights and practical strategies to improve brand performance.

Watch our webinar on mastering Brand and Product Portfolio Analysis in Power BI to:

  • Obtain a holistic view of brand performance.
  • Gain deep insights into market trends and dynamics.
  • Benchmark brand performance against industry standards and competitors.
  • Evaluate price and revenue performance for optimized profitability.
  • Identify potential opportunities and threats.
  • Make informed decisions based on data-driven insights.

What's included

Full video recording
PBIX example used in the webinar
Enjoy & thank you for watching! Don't hesitate to reach out if you have any questions — write to us at [email protected]!

Presenter

Andrej Lapajne

Founder & CEO at Zebra BI

Watch the Video

Download PBIX example
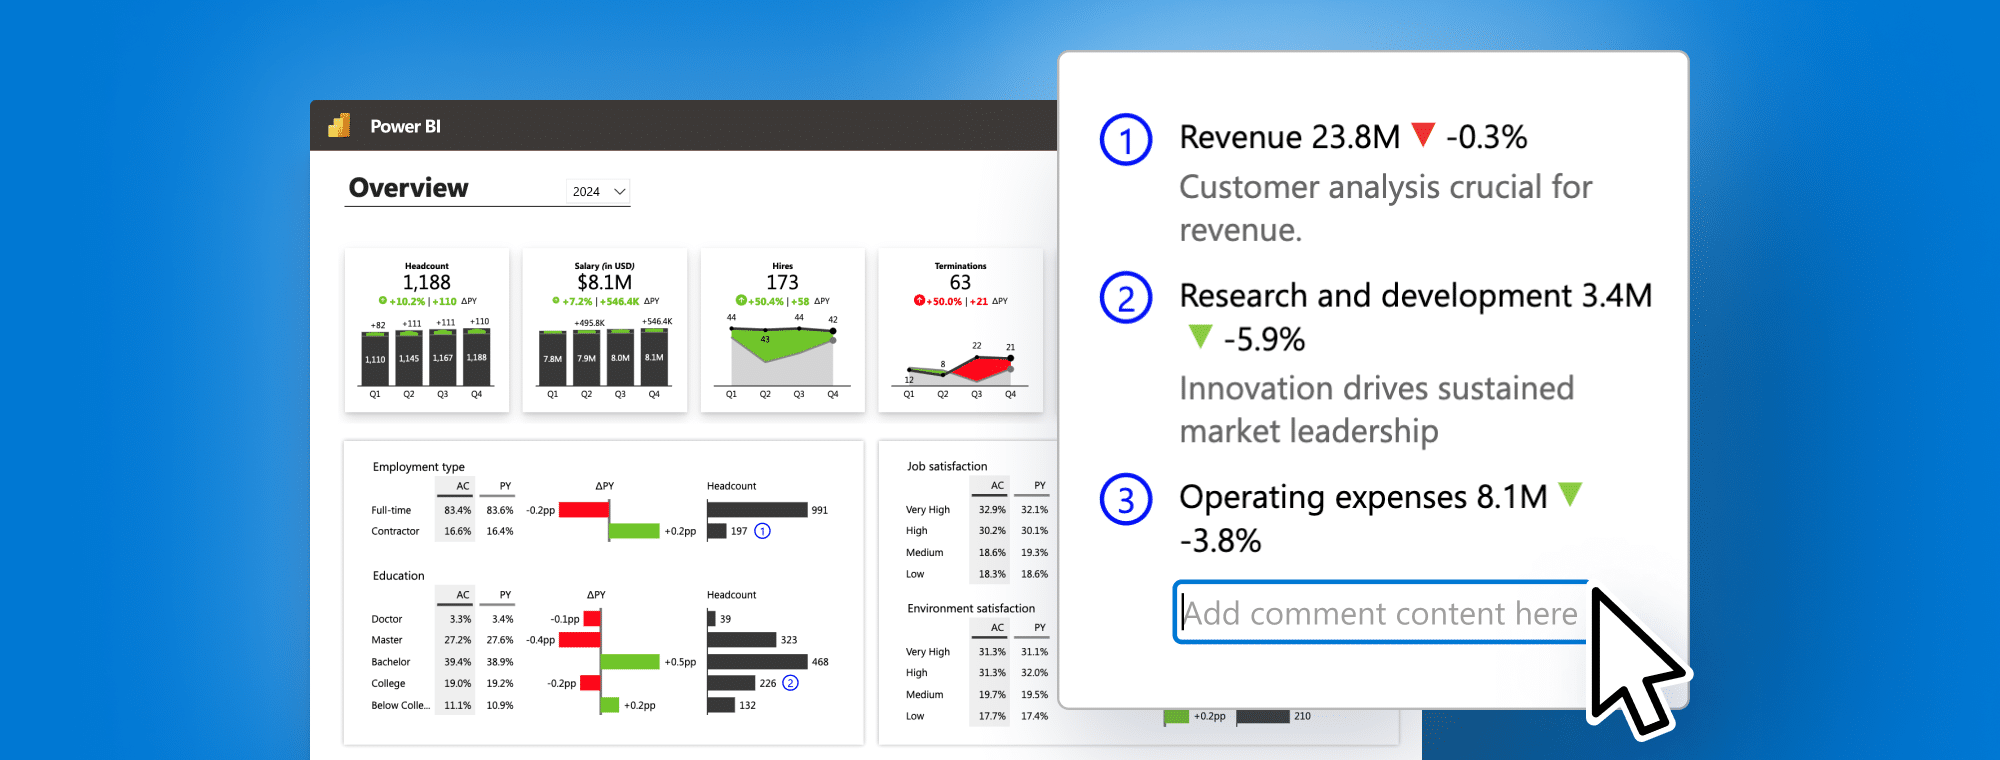
Try it on your own! Download our report templates and add dynamic comments with ease.
Access the materials
Share this

Your Questions

Here are some of the questions that came up during our live session. Thank you for being such a proactive audience. Have more questions? Drop us a note at [email protected]!
If i delete charts by mistake, what happens ? Can i Retrieve my data or chart?

Yes of course, you can go back - the data is always present within the PBI data.

What if the period field are in together in a table format?

It will be filtered by the slicer or not (you can also control which elements interact with each other).

How to add item instead of brand in matrix? Is a tutorial?

You can replace any category in the visualizations from the Data fields list on the right hand side of Andrej's screen. But you can also do this dynamically as we showed in the webinar.

Is it possible to integrate AI so that the comments can be automatically generated by learning from trained data?

Actually we have a standalone tool for that if you are interested: https://zebra-ai.com/

Ready to start uncovering actionable insights from your data?

Explore Zebra BI for Office and Power BI, or start a trial instantly and test our tools on your data. You can also contact us to help you build your first test report and create a custom package for your business.

More Trending Webinars

New
September 12, 2024
Master Cost Management: Elevate Reporting, Tracking, and Efficiency
Master cost management with Zebra BI. Discover advanced techniques to optimize financial reporting, enhance budgeting accuracy, and make smarter, data-driven business decisions for long-term success.
Watch now
April 18, 2024
Commentary Revolution: Transforming Power BI Dashboards with Dynamic Comments
Join our webinar to explore the easiest way so far to do dynamic commentary in Power BI for clearer insights, quicker decisions, and smoother meetings.
Watch now
New
PowerPoint
October 26, 2023
How to create board meeting PowerPoint slide decks like a consultant in 2023
After gathering all the data you need it's time to present it effectively to your managers. And this doesn't mean using many different shapes and colors that tell nothing. Learn practical tips for a professional-looking and actionable PowerPoint slide deck.
Watch now
September 14, 2023
From Data to Decisions: Real-Life Fortune 500 Financial Analysis with Power BI
This webinar is all about financial analysis in Power BI. Take a look at the performance of some of the biggest Fortune 500 companies and use these practical examples to apply them to your data. Don't just create reports, generate insights.
Watch now
May 11, 2023
Zebra BI for Office 2.0 is now available!
Learn how to create stunning, interactive Excel dashboards that provide immediate answers to your business questions and showcase your performance in a visually compelling way. Share your results easily and take your reporting to the next level, whether you're a seasoned BI pro or a passionate Excel enthusiast!
Watch now
Browse All Resources