 September 8th
 February 22nd
Step #1:
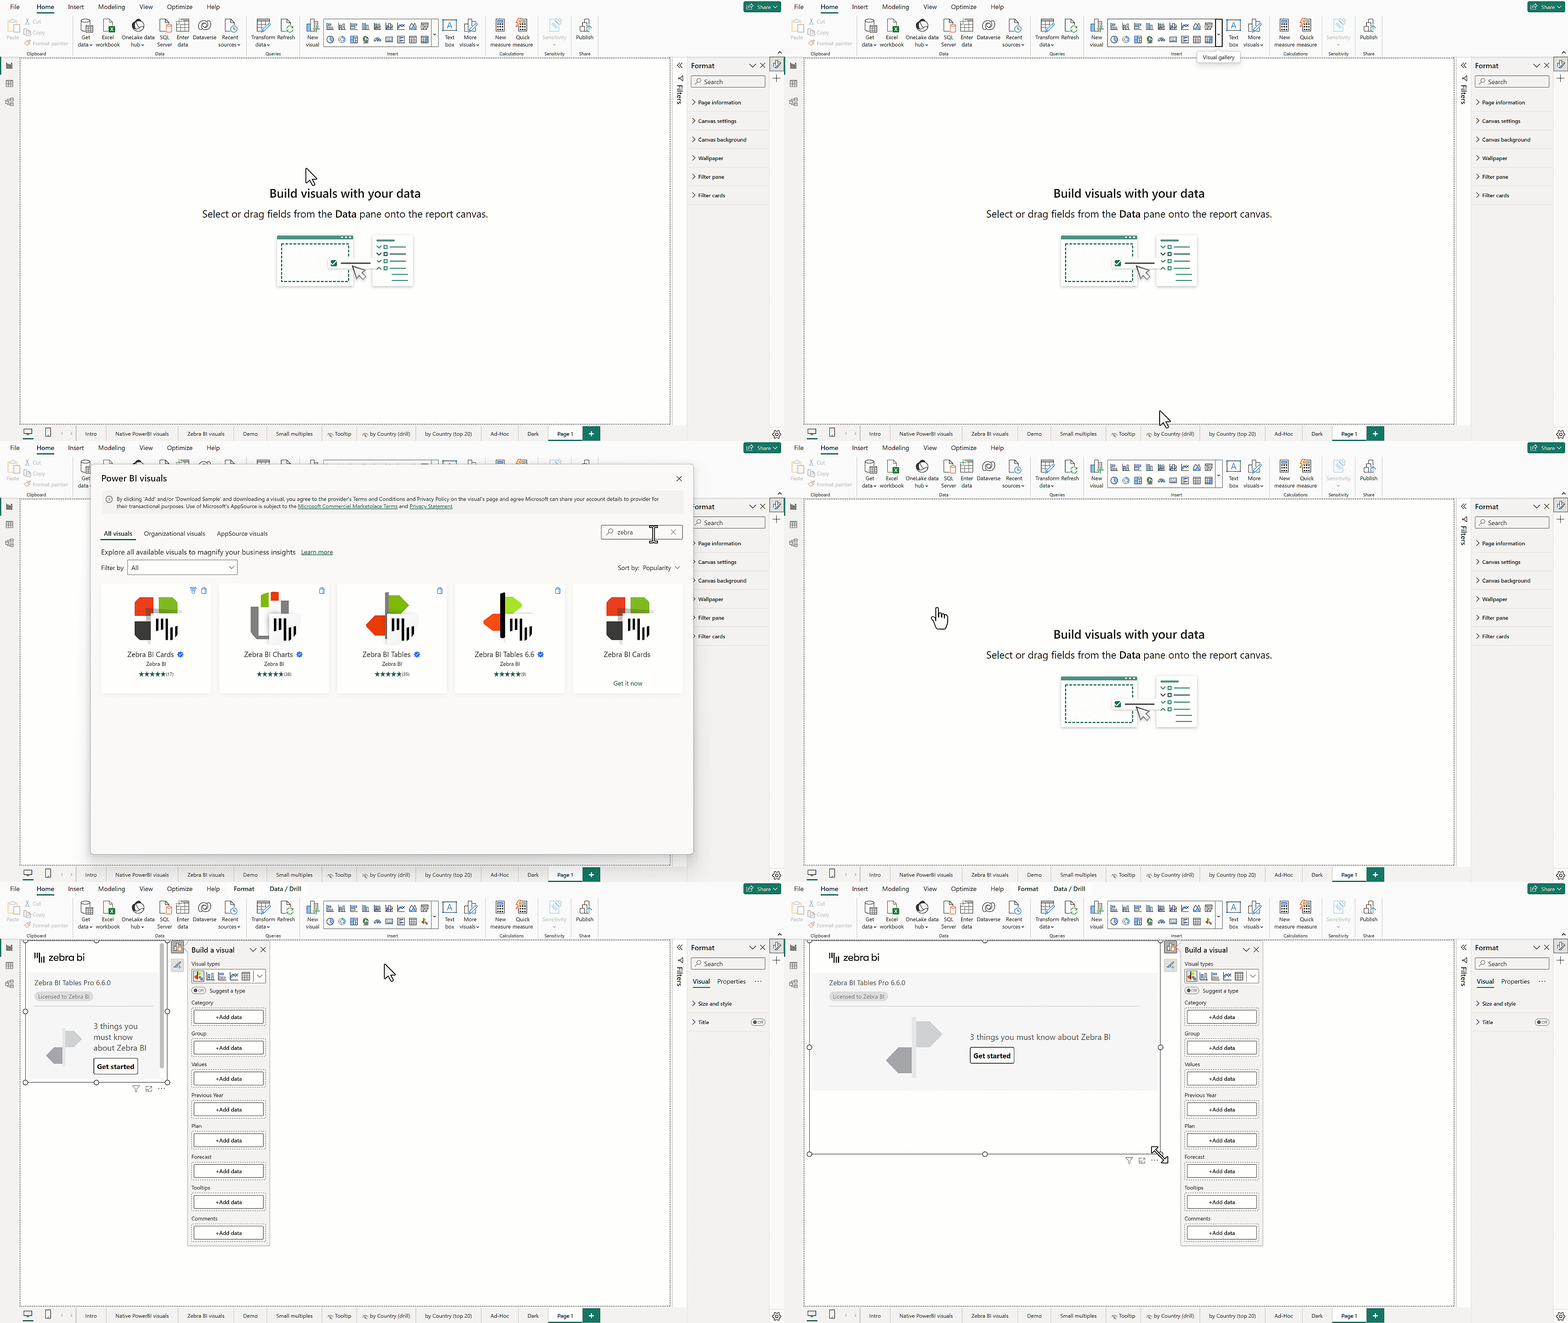
In your Power BI:
After you import visuals, you should receive a notification and see the new icons in the Visualizations pane.
Step #2:
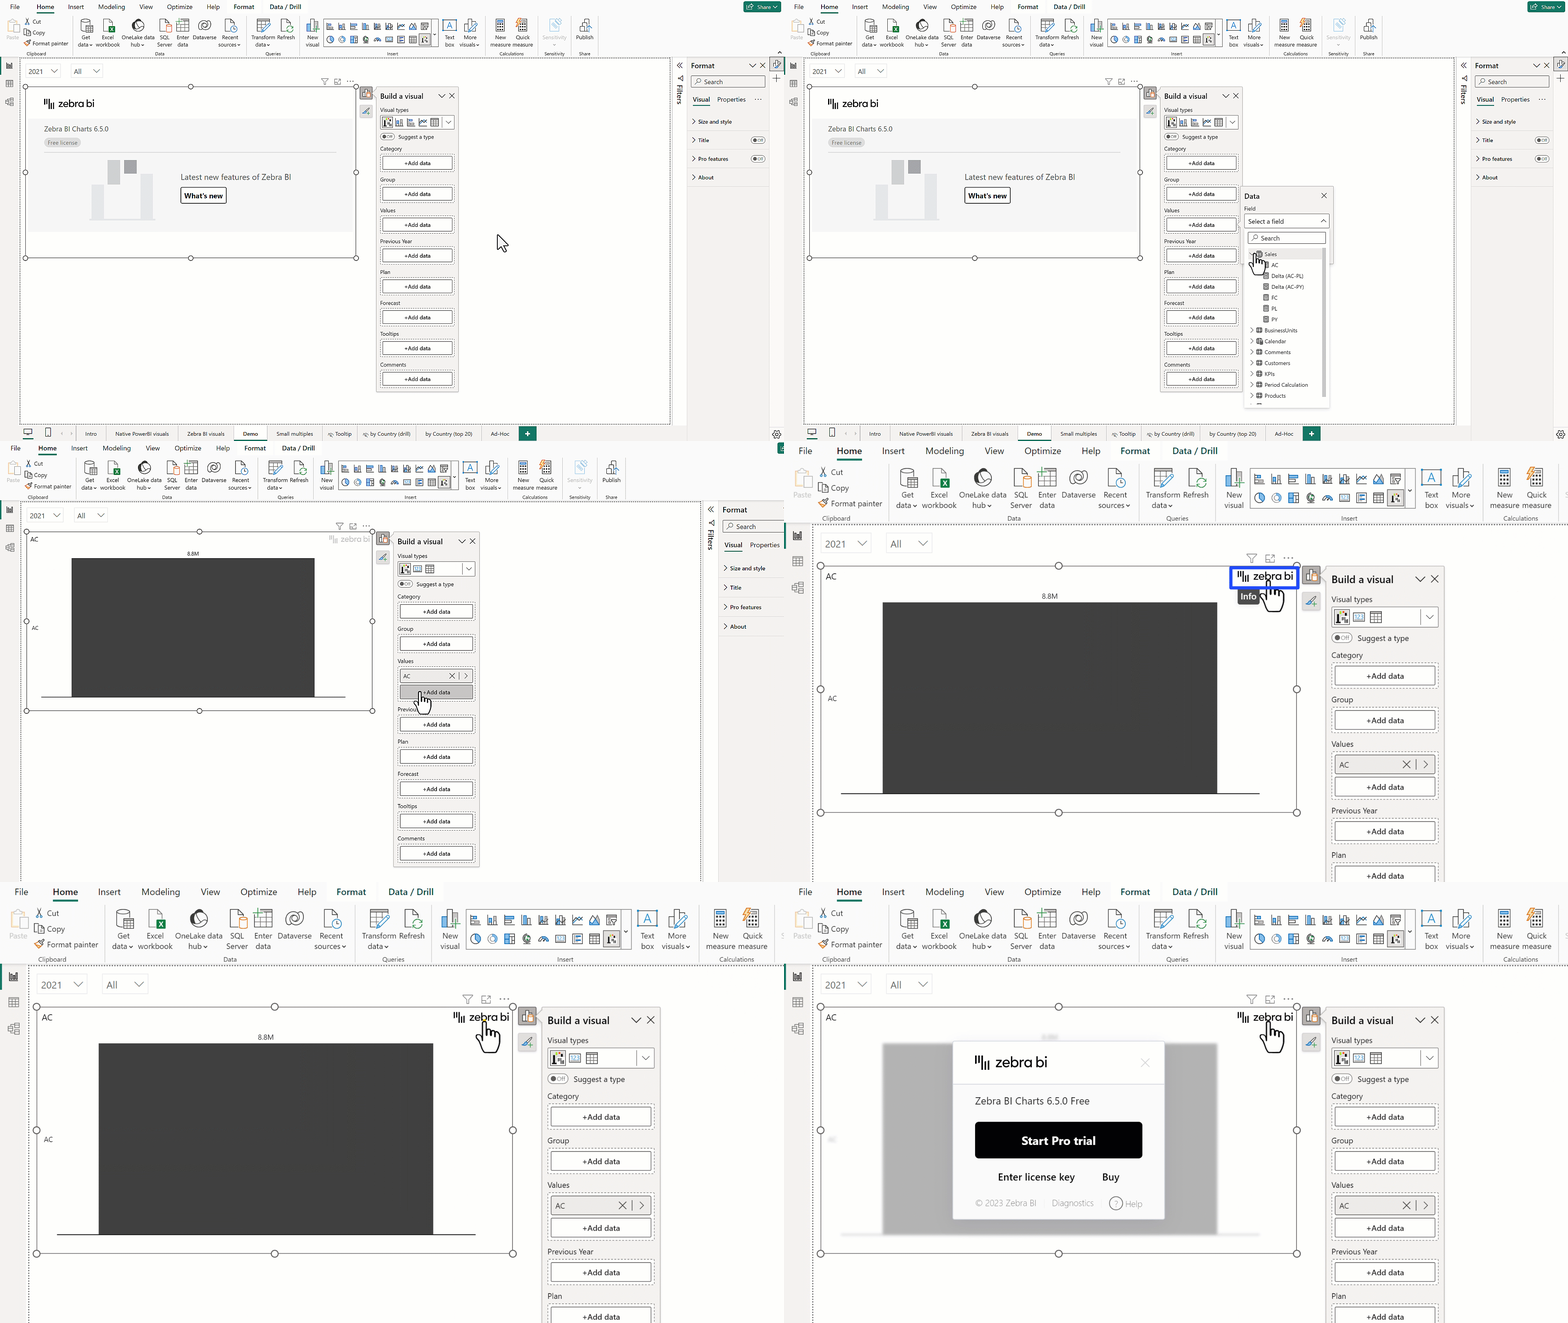
Click on the icon in the Visualization pane to insert the visual into the report page and display a blank landing page.
Select any data field on the right side to create your first Zebra BI table or chart.
Step #3:
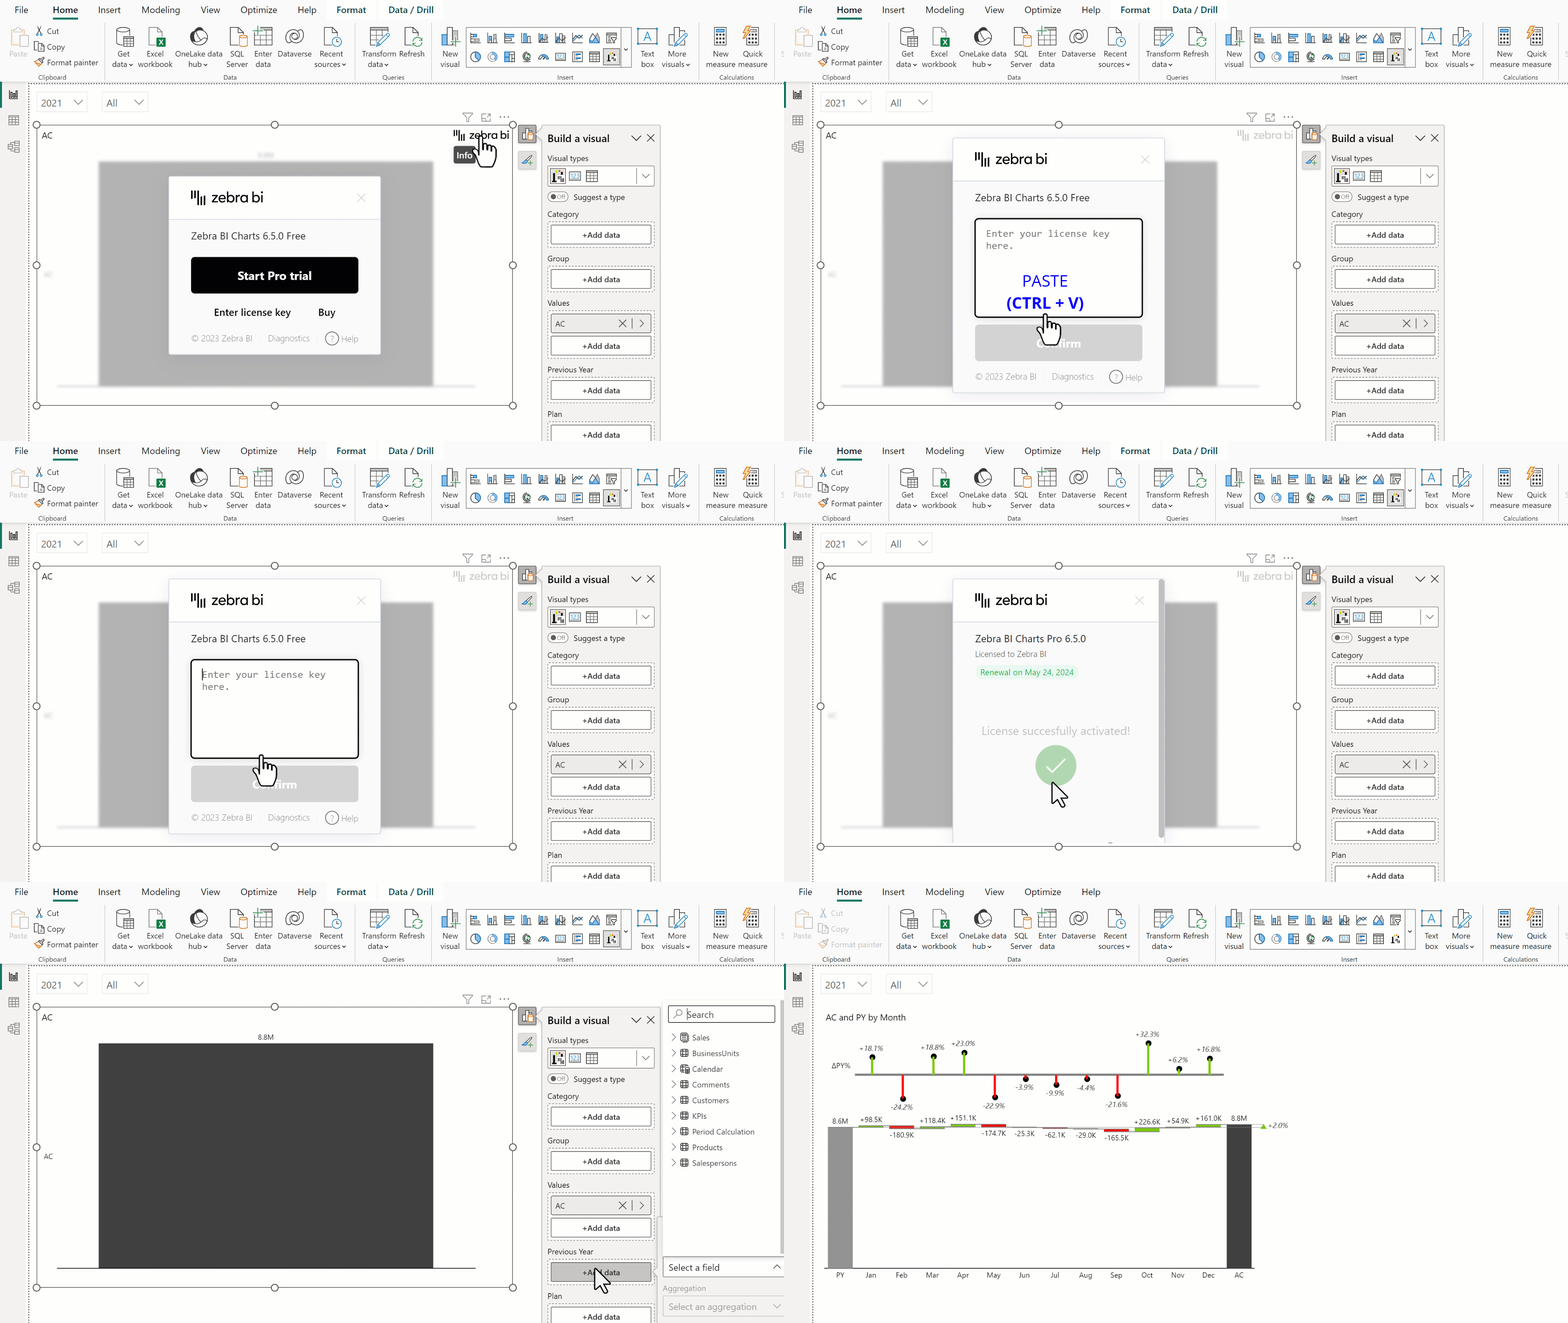
Simply import into your Power BI to start visualizing your data and paste it into the activation window.

Need help with getting started? Zebra BI for Power BI Initial Setup | Zebra BI Knowledge Base
Support contact: [email protected]
