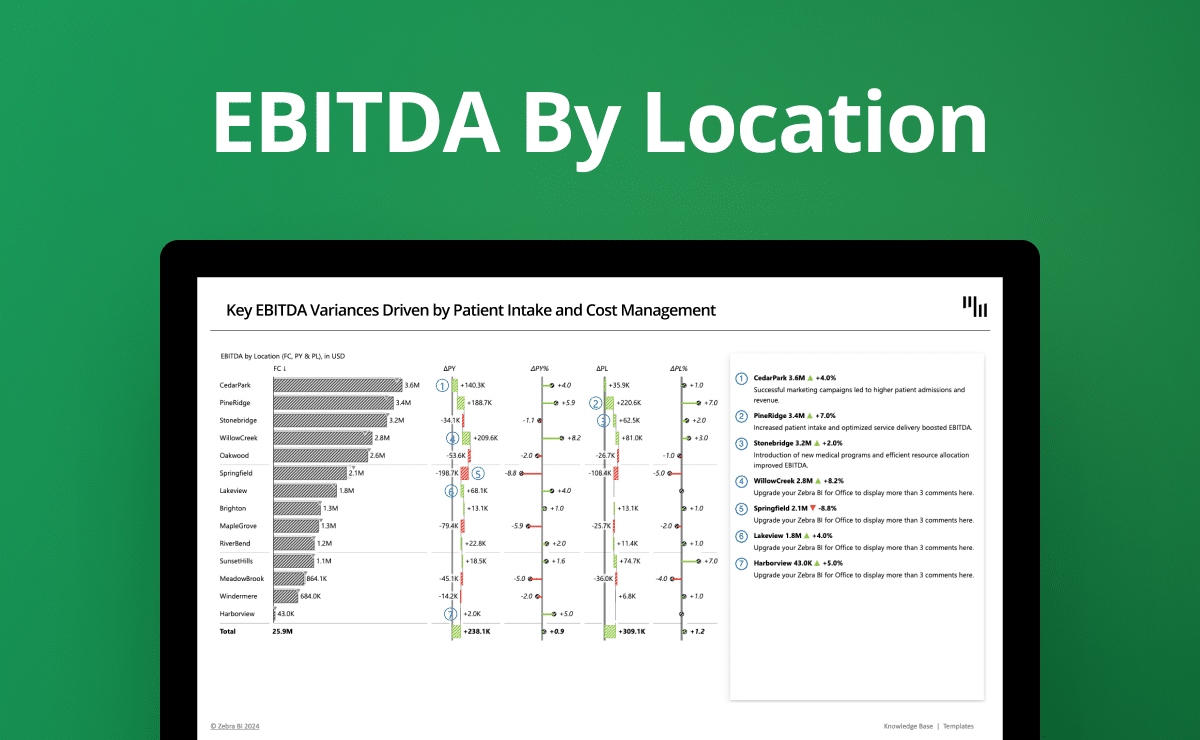
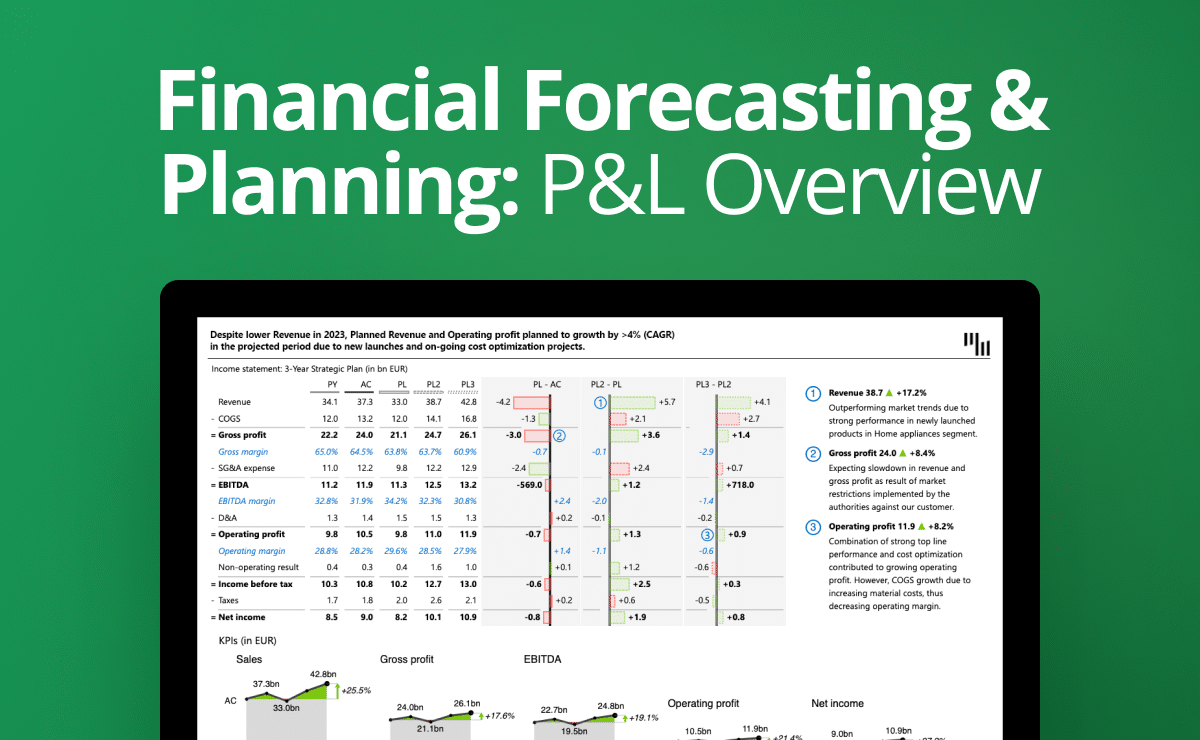
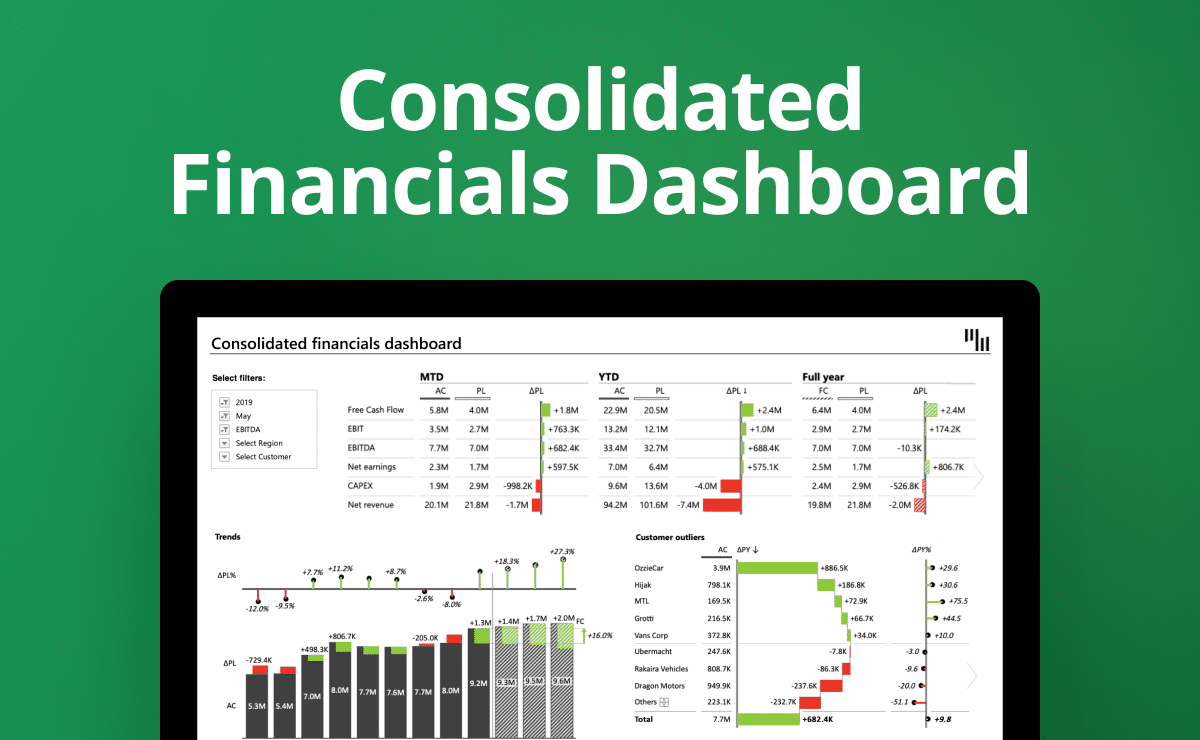
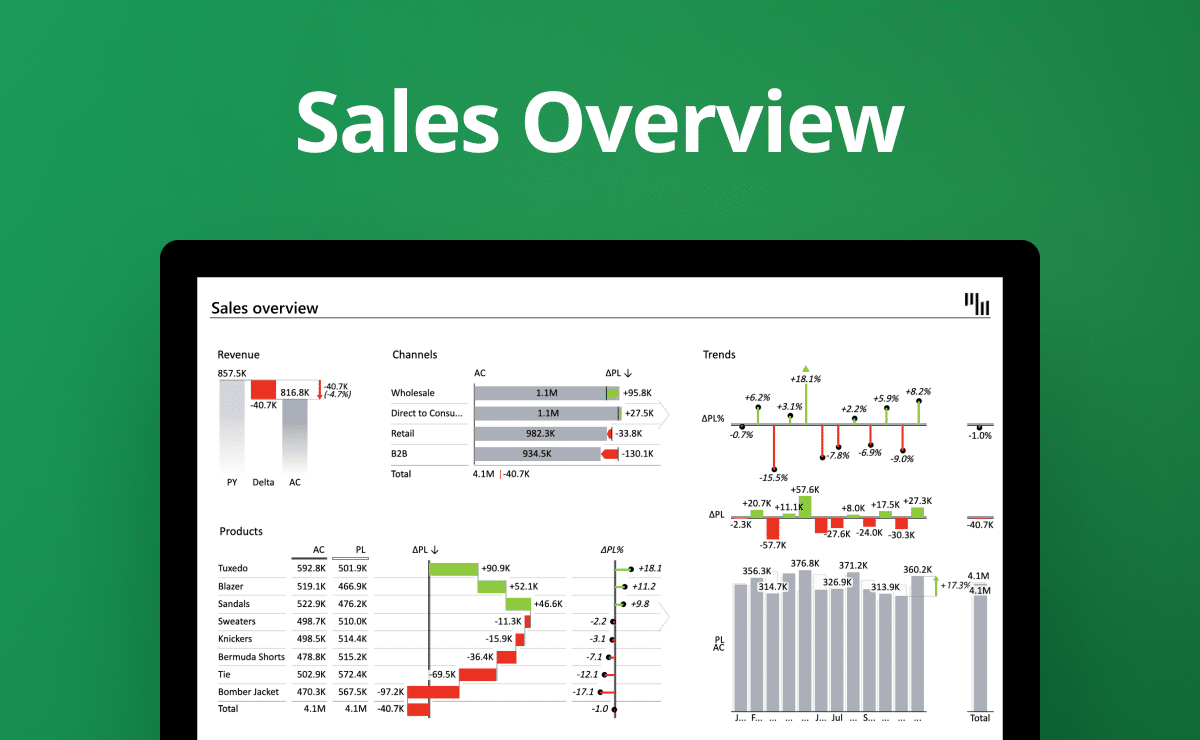
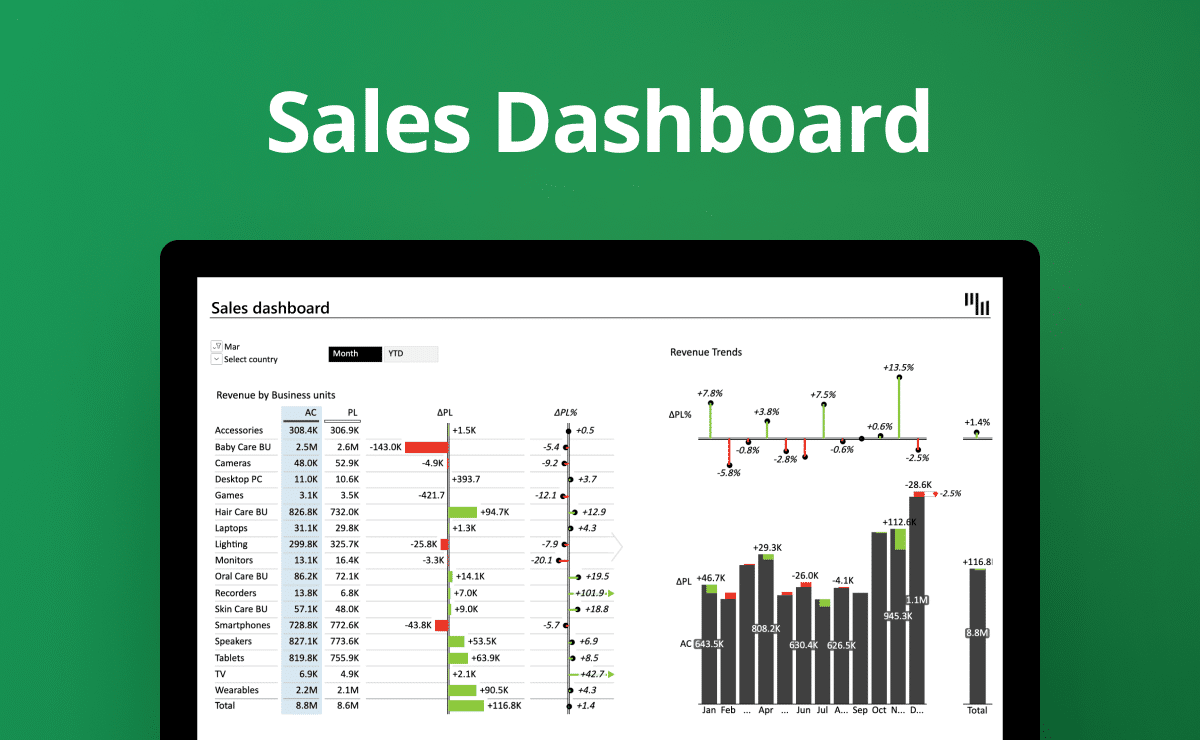
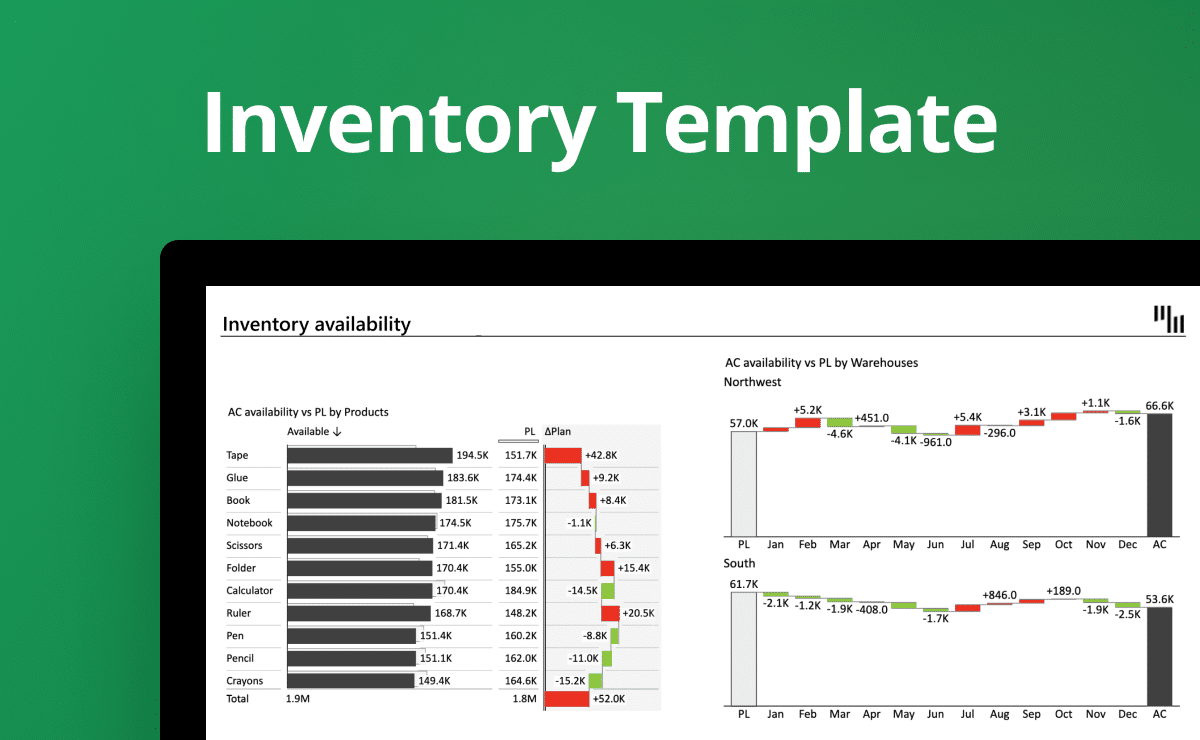
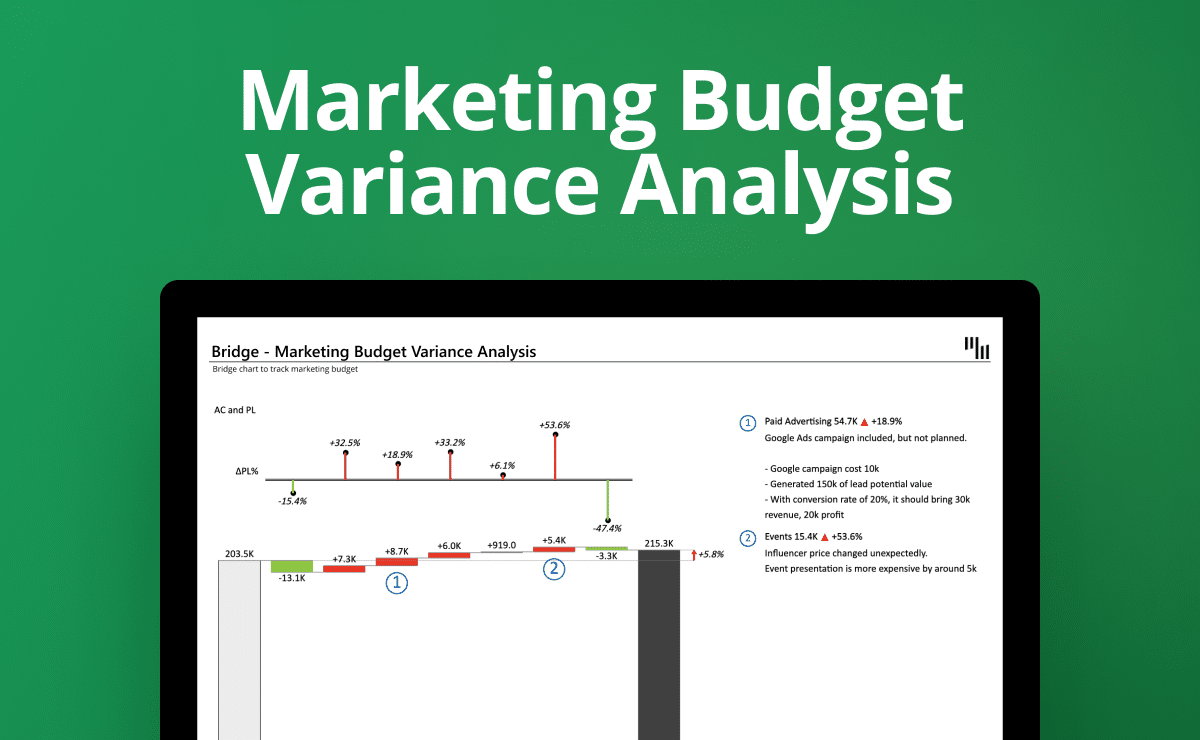
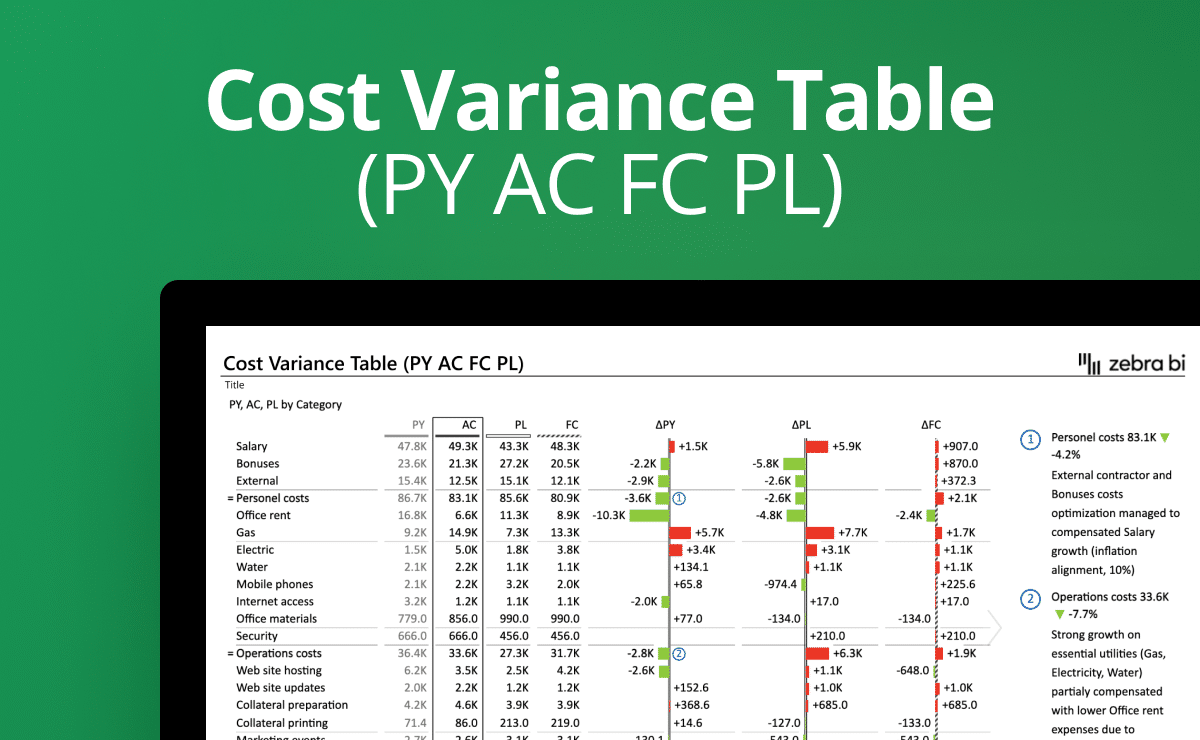
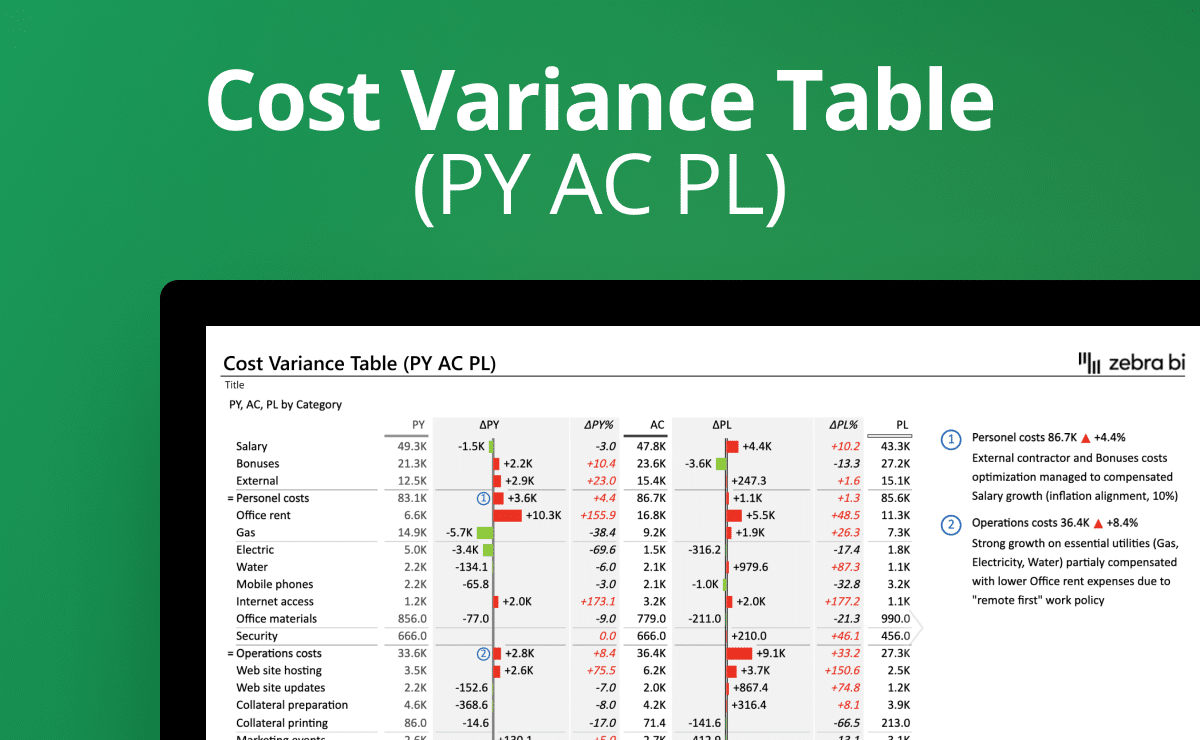
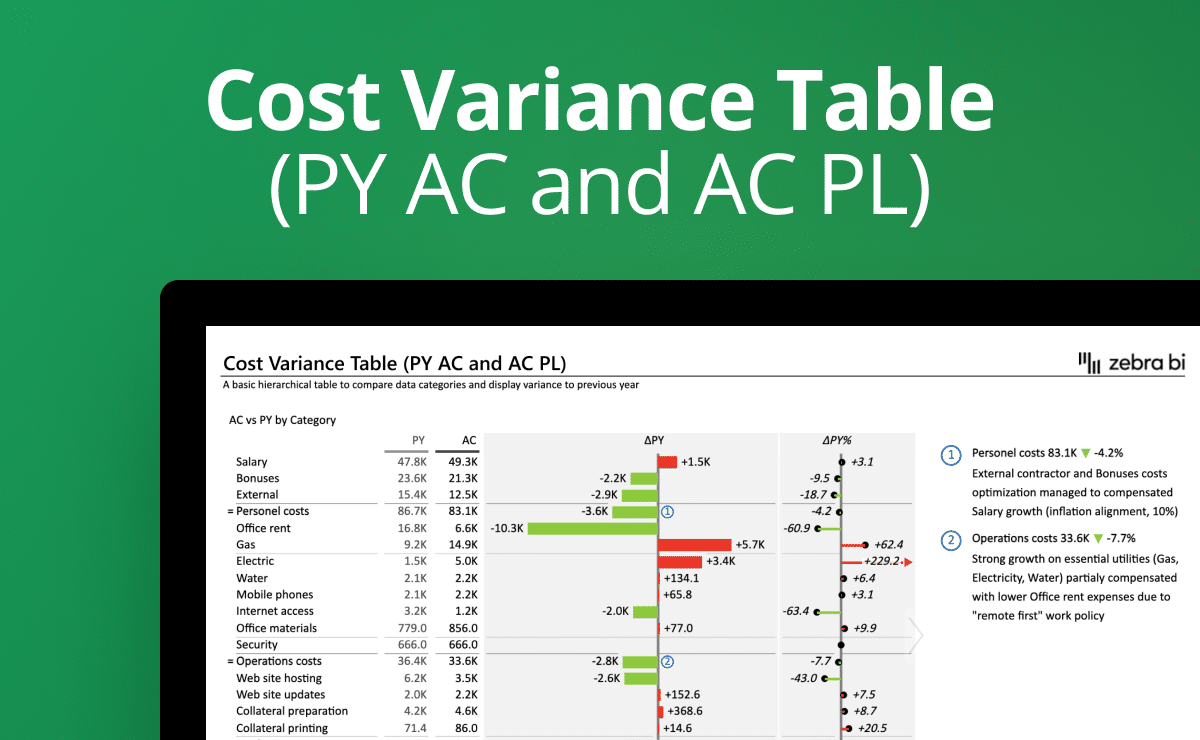
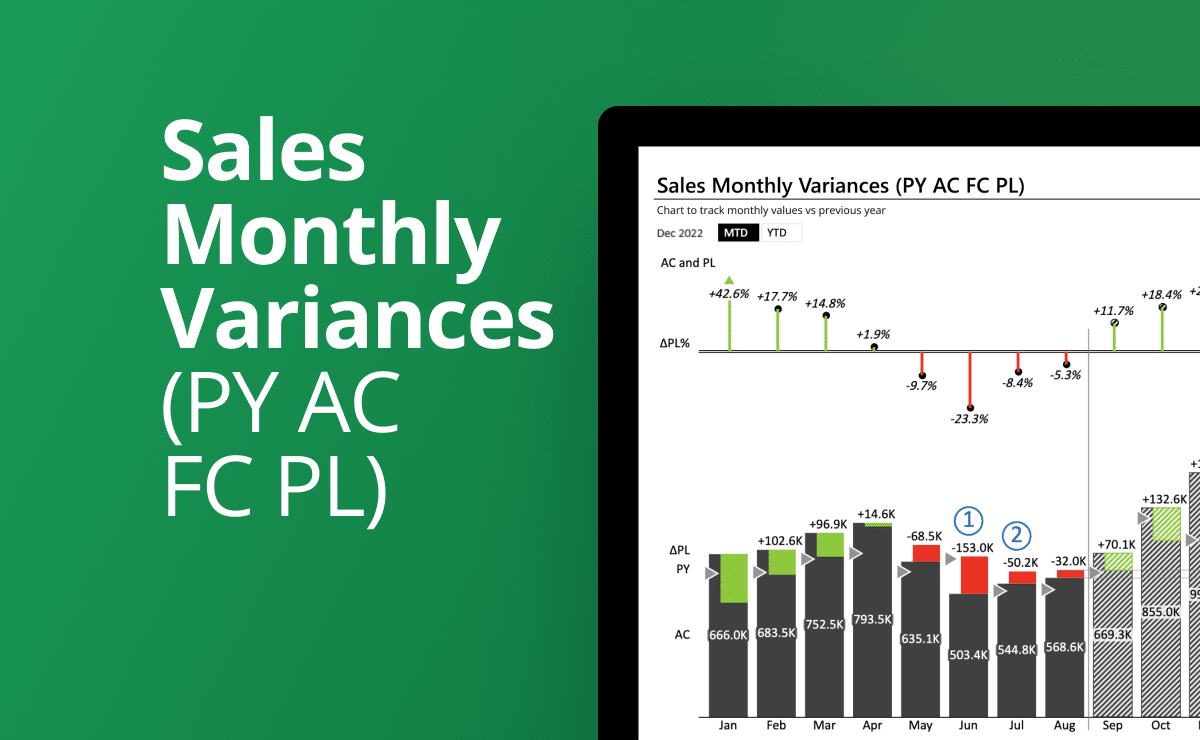
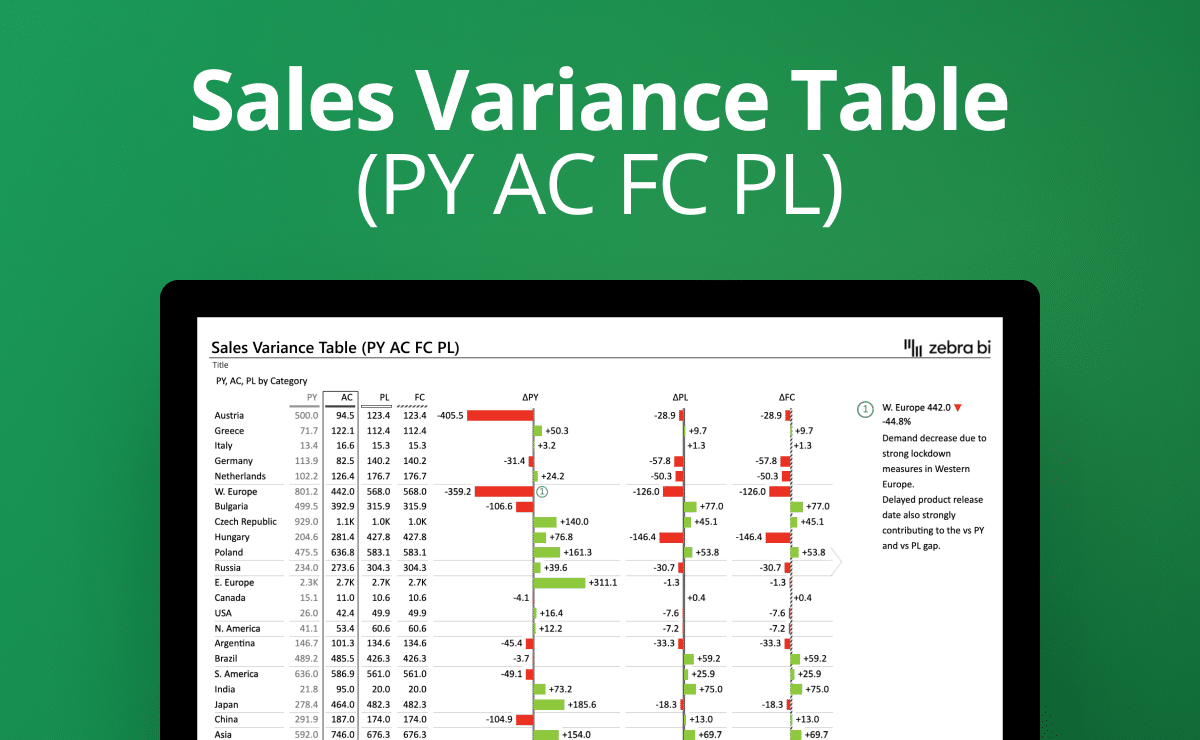
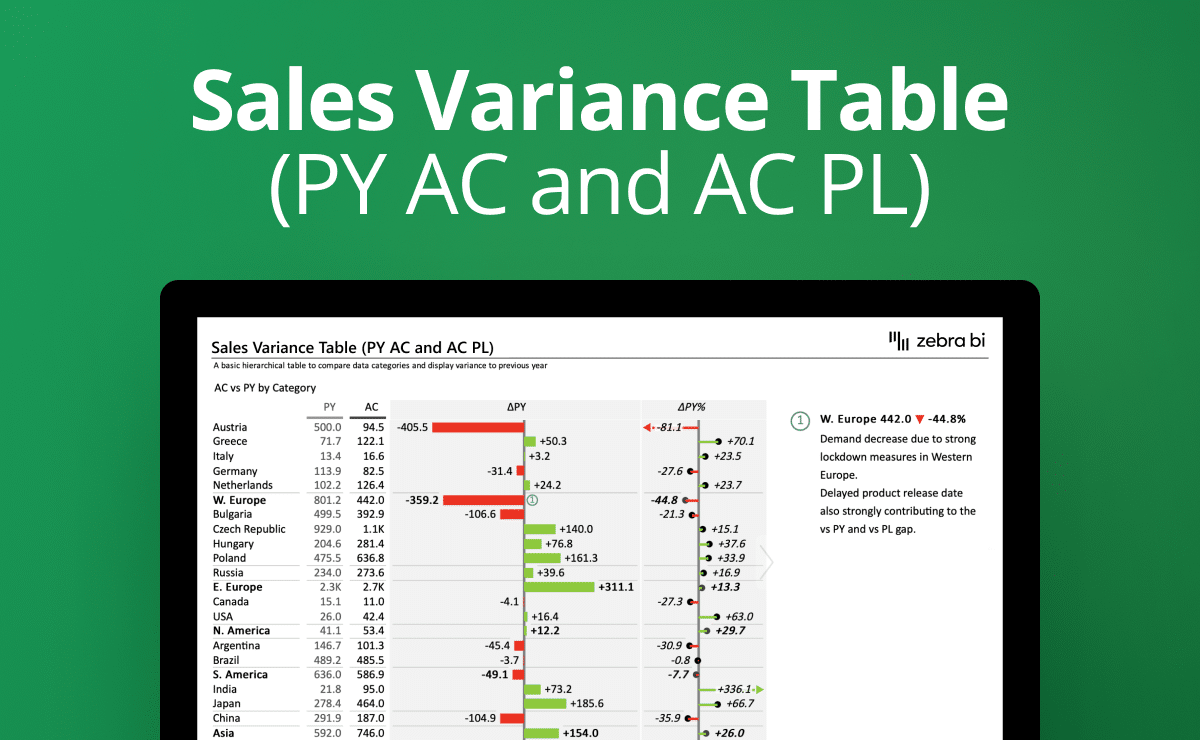
This is a monthly sales variance Excel template that analyses trends over time by comparing the actual (AC), previous year's (PY), and planned data (PL) in the same chart. It features automatically calculated variances presented in a horizontal variance chart, together with dynamic comments for more information.
Features used
Present your monthly sales in the form of an actionable story. Enjoy the preview of how Zebra BI for Office turns your data into concise and compelling insights.
 September 8th
 February 22nd