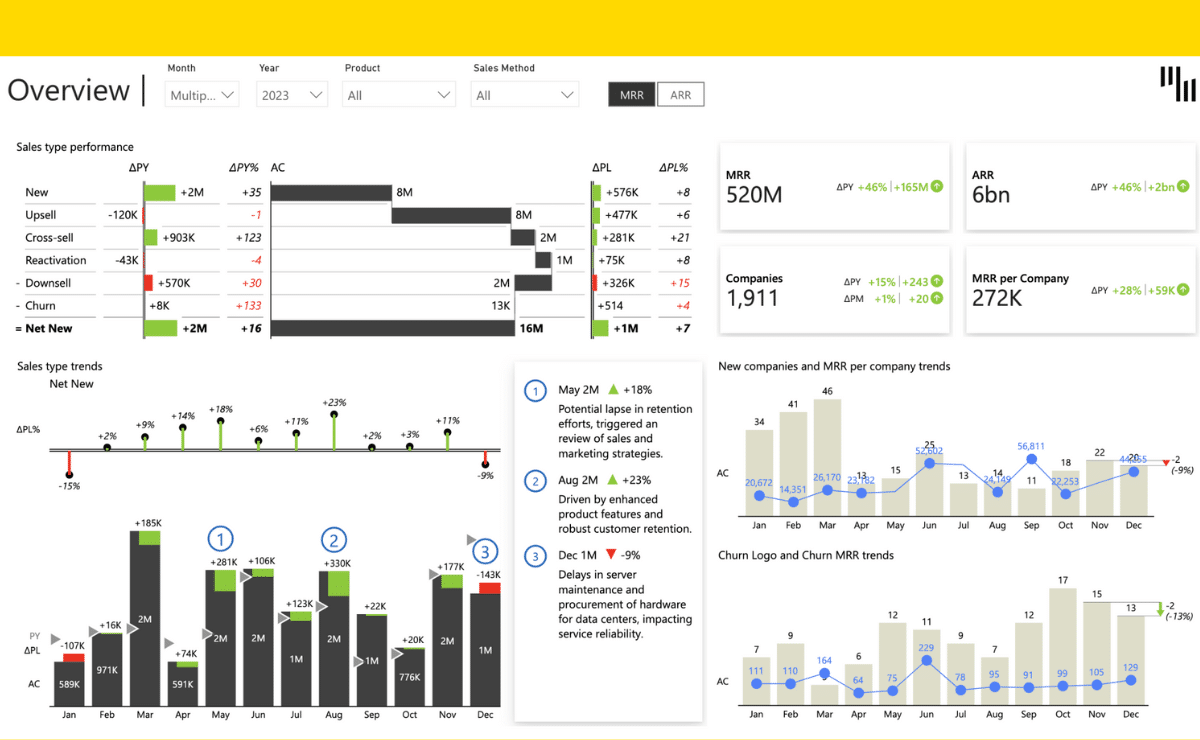
This Power BI example explains the reasons behind the revenue growth and presents top contributors for each category such as price, volume & mix variance, new launches, and discontinued products. If you ever thought doing Price-Volume-Mix in Power BI is tricky, then this is the solution for you.
Play with the interactive demo below. If you click the ⤢ icon at the bottom-right of the report page you'll be able to enjoy the full-screen view.
Try it in your Power BI!
Learn how we help our customers solve real challenges
Driving internal adoption of new reporting tools is not easy. Get practical tips from AbbVie's Senior Financial Data Analyst on how to succeed in this process.
Read about the implementation of Bayer Finance 360 App that became a one-stop shop of business-critical insights for their CFO, managers, and data analysts.
 September 8th
 February 22nd