Real-World Story: KPN crushes board meetings with powerful dashboards
Hear the story of the leading European telco, KPN, and see how they've transformed their board room meetings with actionable reports.
What's included
Full video recording
Enjoy & thank you for watching! Don't hesitate to reach out if you have any questions — write to us at [email protected]!
Presenters
Pieter Jan Devries
Product Owner Managed Dashboarding at KPN
Wilco Nagtzaam
Senior Financial Controller at KPN
Andrej Lapajne
Founder & CEO at Zebra BI
Watch the Video
(2:22) About KPN
(3:48) The story of KPN’s transformation
(6:41) KPN board meetings
(8:43) Transformation development challenges
(10:28) KPN Ambassadors
(12:11) Most important success factors
(13:55) KPN solutions: Dynamic features of the dashboard
(17:36) Gaining additional insights from the dashboard
(20:20) Breadcrumb navigation and quick filtering
(22:33) Visuals reflecting the true labels
(26:55) Why are charts so wide?
(28:26) Interactive tables
(30:43) The philosophy of the tool
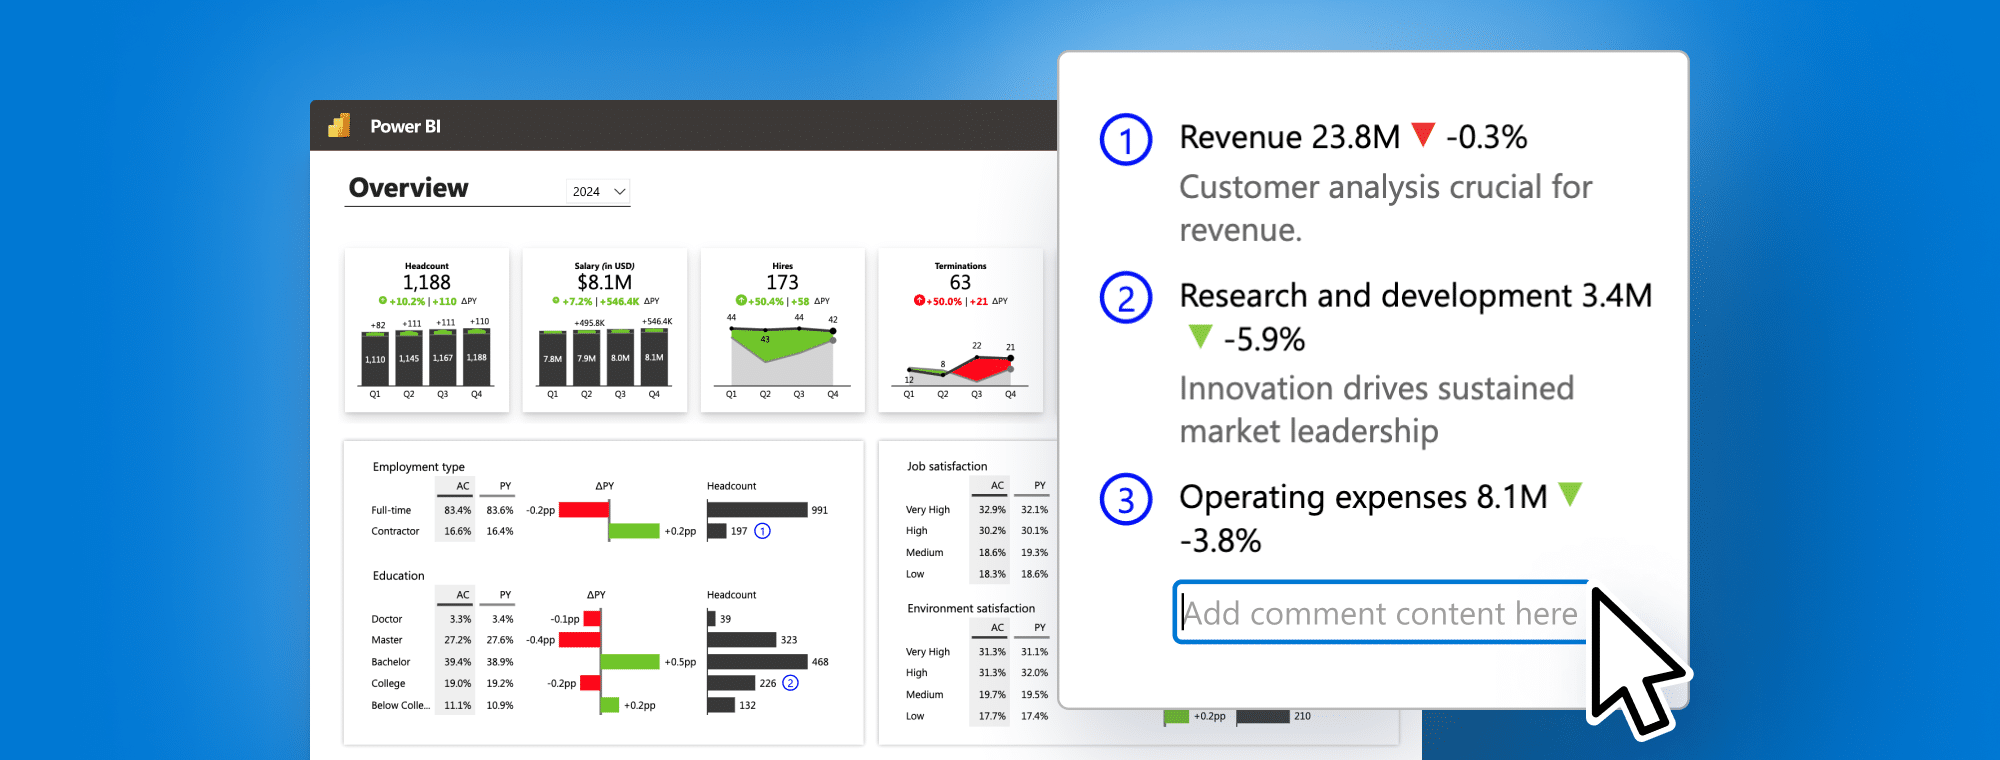
(33:36) Linked comments
(35:31) KPI dashboard features
(41:46) KPN’s future plans
(43:45) Key takeaways
(46:22) Resources
(47:11) Q & A
Share this
Ready to start uncovering actionable insights from your data?
Explore Zebra BI for Office and Power BI, or start a trial instantly and test our tools on your data. You can also contact us to help you build your first test report and create a custom package for your business.
Master cost management with Zebra BI. Discover advanced techniques to optimize financial reporting, enhance budgeting accuracy, and make smarter, data-driven business decisions for long-term success.
Unlock the power of product portfolio analysis with Zebra BI in Power BI. Learn to visualize and analyze product performance, identify growth opportunities, and drive strategic business decisions with data-driven insights.
Join our webinar to explore the easiest way so far to do dynamic commentary in Power BI for clearer insights, quicker decisions, and smoother meetings.
After gathering all the data you need it's time to present it effectively to your managers. And this doesn't mean using many different shapes and colors that tell nothing. Learn practical tips for a professional-looking and actionable PowerPoint slide deck.
This webinar is all about financial analysis in Power BI. Take a look at the performance of some of the biggest Fortune 500 companies and use these practical examples to apply them to your data. Don't just create reports, generate insights.

 September 8th
 February 22nd