A brand new Zebra BI for Office is released! We will continue to support Zebra BI Add-in for Excel for a while longer, but all the game-changing features will be added to the new version. Be free to try it on your own data.
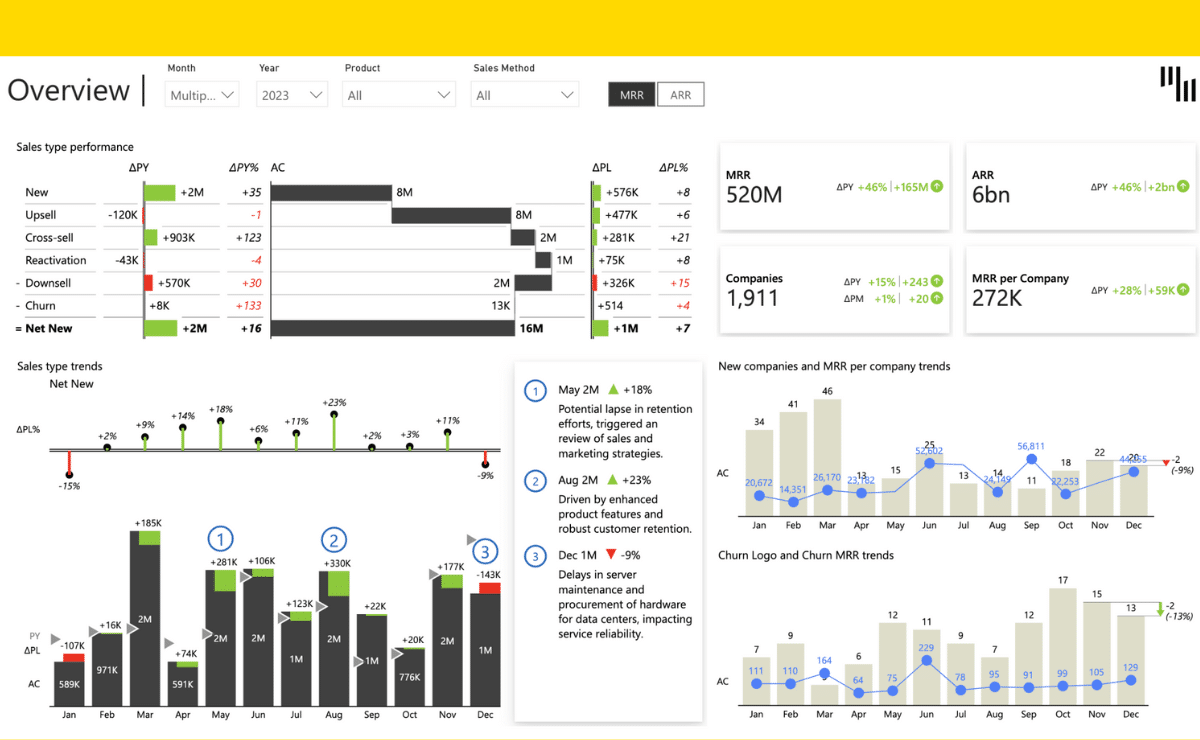
This advanced Excel template visualizes monthly data for all 4 business scenarios: AC, PY, BU and FC. It displays absolute variances using a waterfall chart and also relative variances using lollipop charts.
Learn how we help our customers solve real challenges
Driving internal adoption of new reporting tools is not easy. Get practical tips from AbbVie's Senior Financial Data Analyst on how to succeed in this process.
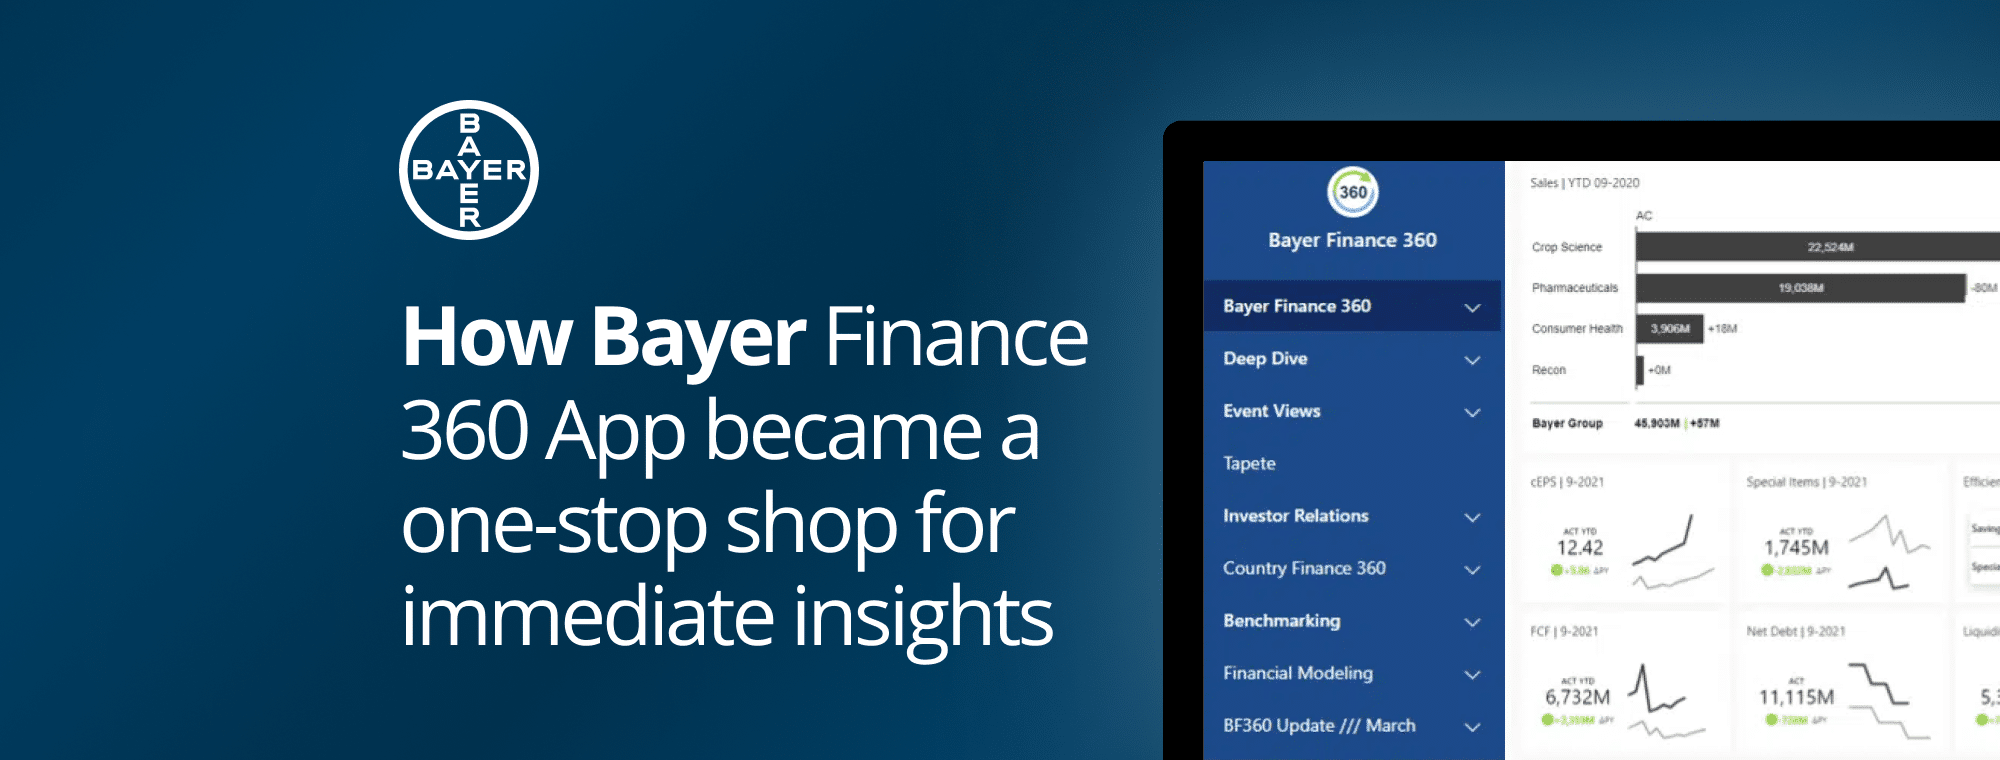
Read about the implementation of Bayer Finance 360 App that became a one-stop shop of business-critical insights for their CFO, managers, and data analysts.
 September 8th
 February 22nd